PDF Charts
PDF Charts streamlines the creation of charts with an intuitive interface, allowing users to add dynamic data seamlessly and download PDFs instantly.
Tags: AI Charting
Visit AI tool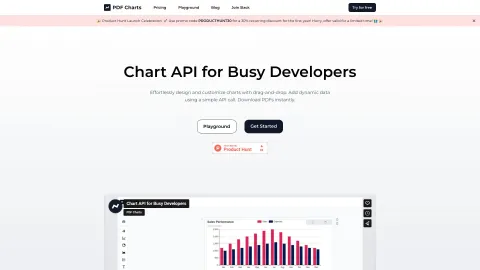

PDF Charts streamlines the creation of charts with an intuitive interface, allowing users to add dynamic data seamlessly and download PDFs instantly.
Tags: AI Charting
Visit AI tool
What is PDF Charts? PDF Charts simplifies the process of creating and customizing charts. Users can drag-and-drop to design charts, integrate dynamic data using simple API calls, and download the resulting charts as PDFs. This tool is ideal for developers and professionals who need to generate visually appealing charts quickly and efficiently without the need for extensive coding or design skills. Who will use PDF Charts? Developers Data Analysts Business Professionals Educators Researchers How to use the PDF Charts? Step1: Sign up and log in to PDF Charts. Step2: Open the chart designer tool. Step3: Use drag-and-drop features to design your chart. Step4: Integrate dynamic data via API calls. Step5: Customize the chart appearance. Step6: Preview your chart. Step7: Download the chart as a PDF file. Platform web
The Core Features of PDF Charts Drag-and-drop chart design Dynamic data integration API support for data input PDF export The Benefits of PDF Charts Time-saving with drag-and-drop functionality Easily customizable charts Seamless integration of dynamic data Instant PDF downloads PDF Charts's Main Use Cases & Applications Creating business reports Generating data visualizations for presentations Academic research reports Real-time data monitoring and analysis
FAQs of PDF Charts What types of charts can I create? You can create a wide range of charts including bar, line, pie, and more. How do I start using PDF Charts? Simply sign up on our website, log in, and start designing your charts using our intuitive drag-and-drop tool. Can I integrate live data? Yes, you can integrate dynamic data using our API for real-time chart updates. Is there a limit to the number of charts I can create? No, you can create as many charts as needed with your account. Can I customize the appearance of my charts? Yes, there are various customization options available to make your charts visually appealing. Do I need coding skills to use PDF Charts? No, the drag-and-drop interface makes it easy for anyone to create charts without coding. Is there an option to save my charts? Yes, you can save your charts and download them as PDF files. Can I try PDF Charts for free? Please visit our website for information on free trials and pricing plans. Is there a support team I can contact? Yes, you can contact our support team via email for assistance. Is PDF Charts compatible with other tools? Yes, PDF Charts integrates with various data sources and tools through API support.
AI Charting
Contact: https://twitter.com/PDFCharts
Related AI Tools: